Bitcoin Price Prediction
Project Summary
This project investigates the use of machine learning to predict the daily directional movement (Trend) of Bitcoin (BTC). Framed as a binary classification problem, the study analyzes nearly a decade of historical data (2014–2023), integrating BTC price action with macroeconomic proxies like the NASDAQ and Gold. By transforming volatile price data into stationary signals, the project aims to support algorithmic trading and risk management strategies.
Technical Design Elements
The predictive pipeline is constructed using several advanced design elements:
Feature Engineering: Creation of 15+ engineered features, including 7-day and 30-day Moving Averages (MA) and Rolling Volatility measures to capture momentum and market stress.
Inter-Asset Analysis: Integration of NASDAQ and Gold datasets to identify cross-market correlations and tech-sector influences on crypto markets.
Data Preprocessing: Robust scaling of features and stationarity checks to ensure compatibility with gradient-boosted trees.
Algorithm Selection: Comparative analysis of multiple models, with XGBoost selected for its superior ability to handle non-linear dependencies in financial time-series data.
1. Exploratory Data Analysis (EDA)
The initial phase focuses on understanding the distribution of returns and the relationships between Bitcoin and traditional financial assets.
# Extract from Person2_Elijah_BTC.ipynb
import seaborn as sns
import matplotlib.pyplot as plt

# Plotting the daily return distribution
plt.figure(figsize=(10, 6))
sns.histplot(df['BTC_Daily_Return'], kde=True, bins=100)
plt.title('Distribution of Bitcoin Daily Returns')
plt.show()

# Generating correlation heatmap
corr = df[['BTC Close', 'NASDAQ Close', 'Gold Close', 'Trend']].corr()
sns.heatmap(corr, annot=True, cmap='coolwarm')
Market Overview and Trends 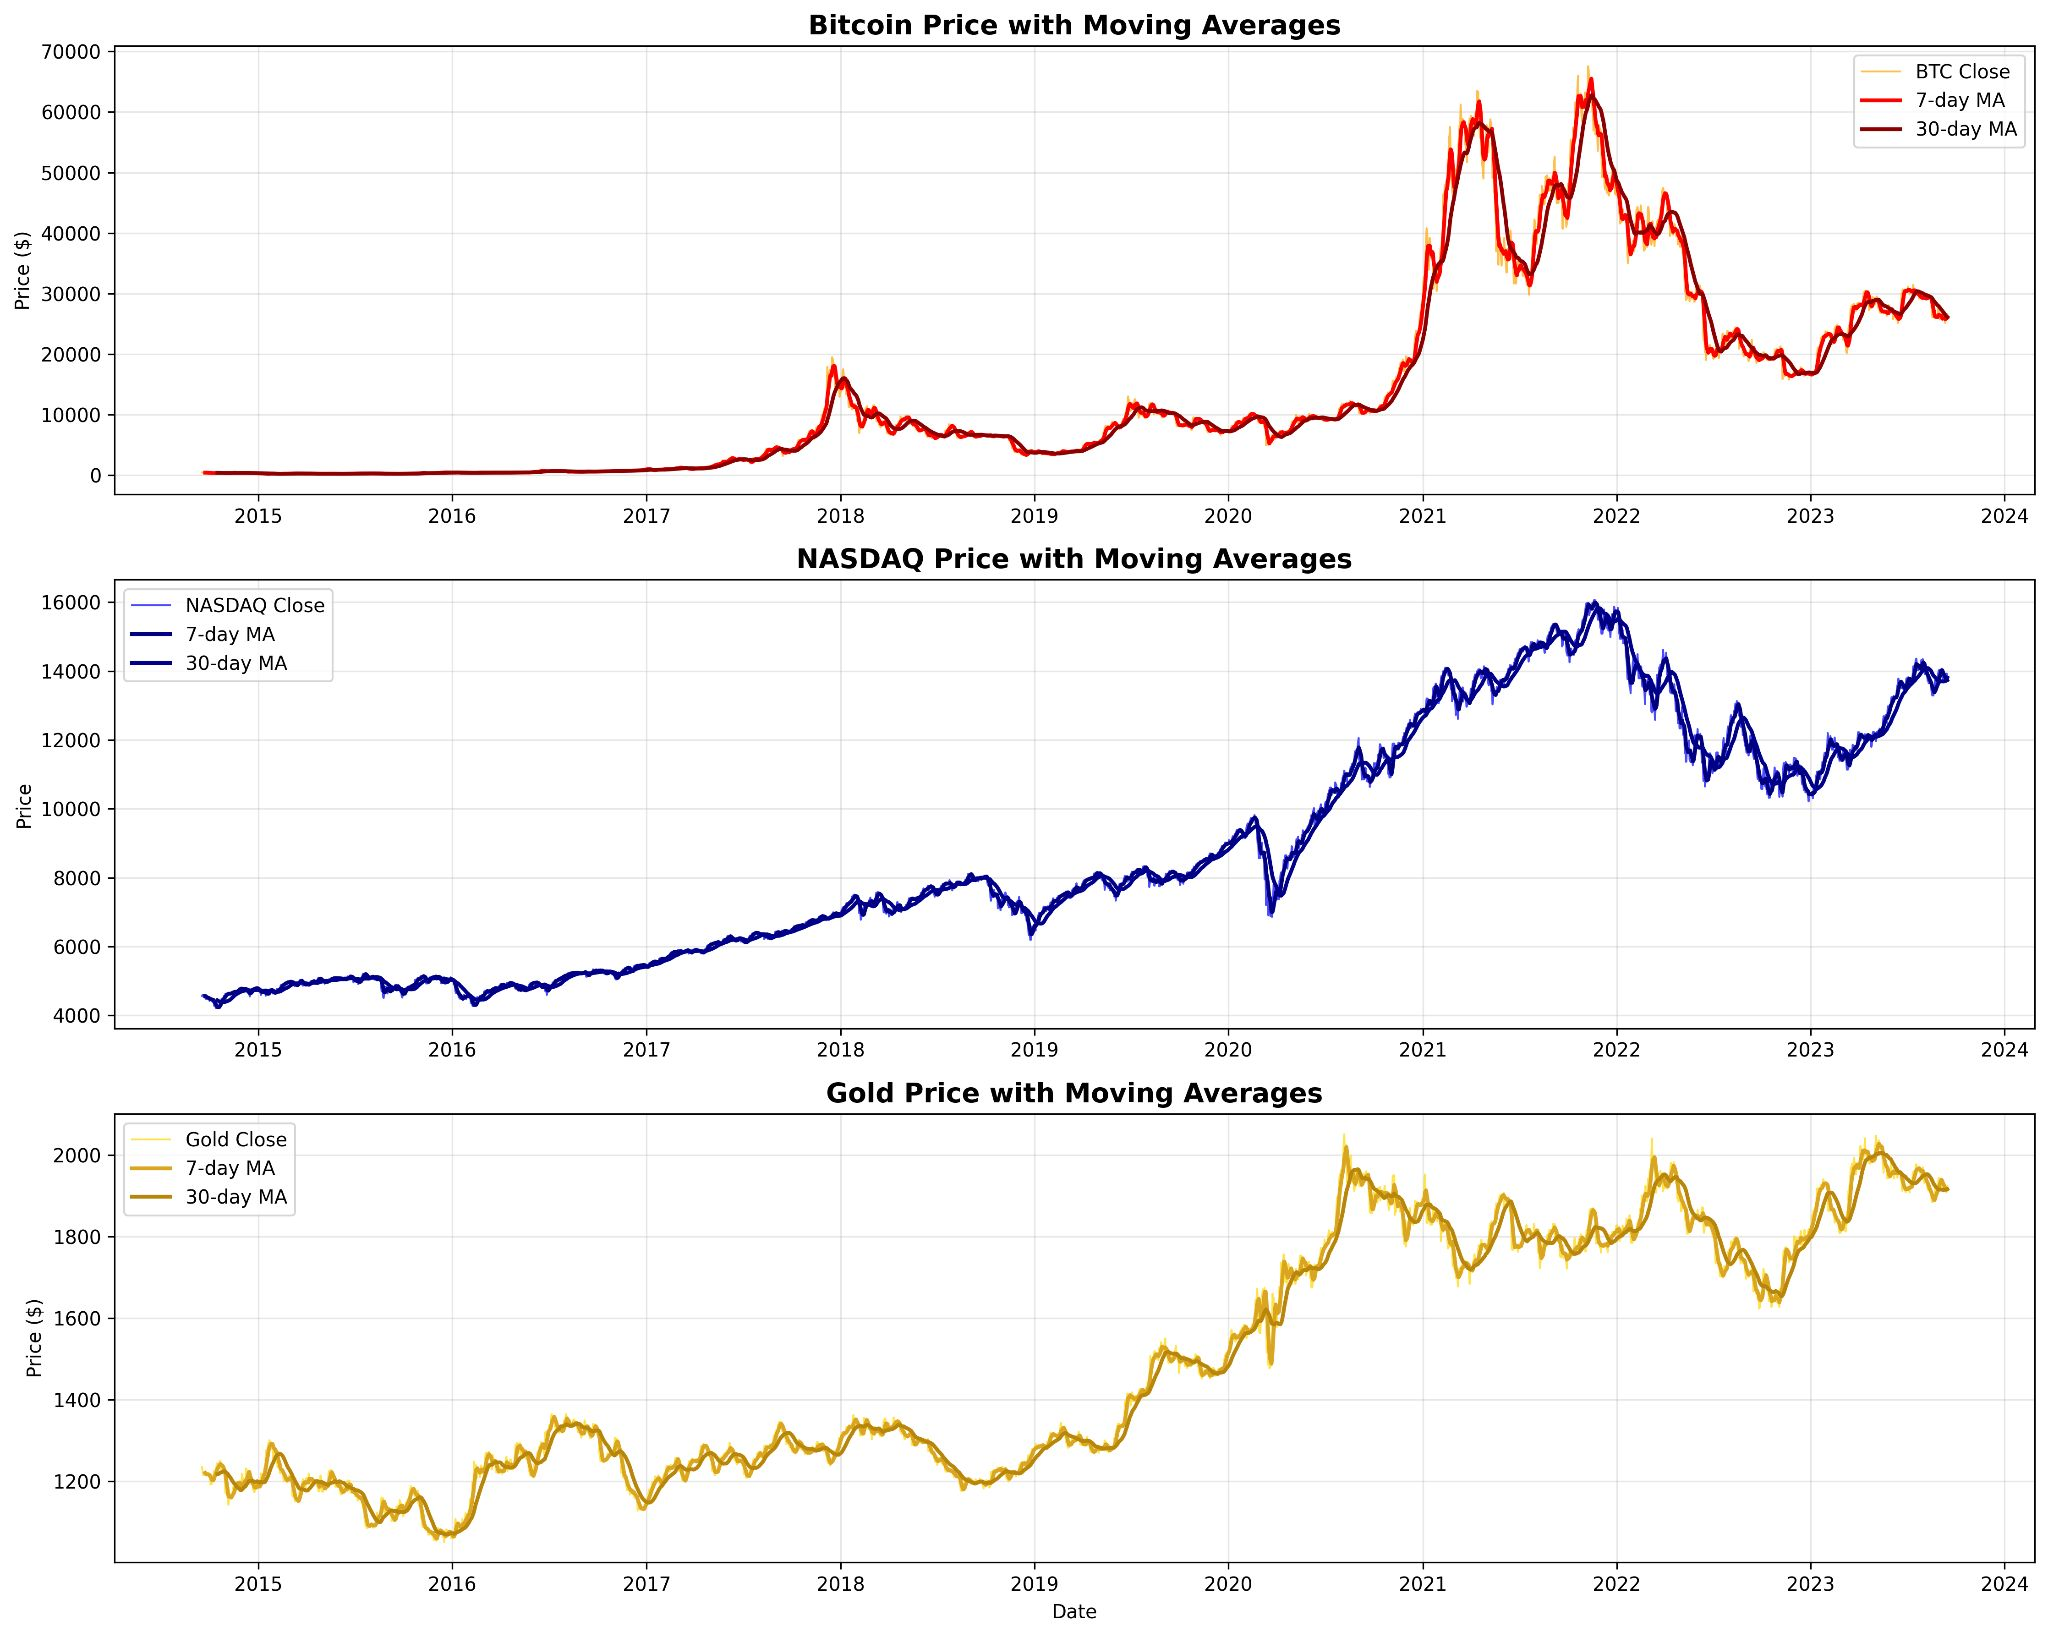 Analysis: The primary EDA highlights the extreme volatility of BTC compared to Gold and NASDAQ, showcasing the periodic “bull runs” and subsequent corrections throughout the 9-year sample period.
Daily Return Distribution  Analysis: The distribution of returns shows “fat tails,” indicating that extreme price movements occur more frequently than a normal distribution would suggest—a key factor in model risk assessment.
Asset Correlation Matrix 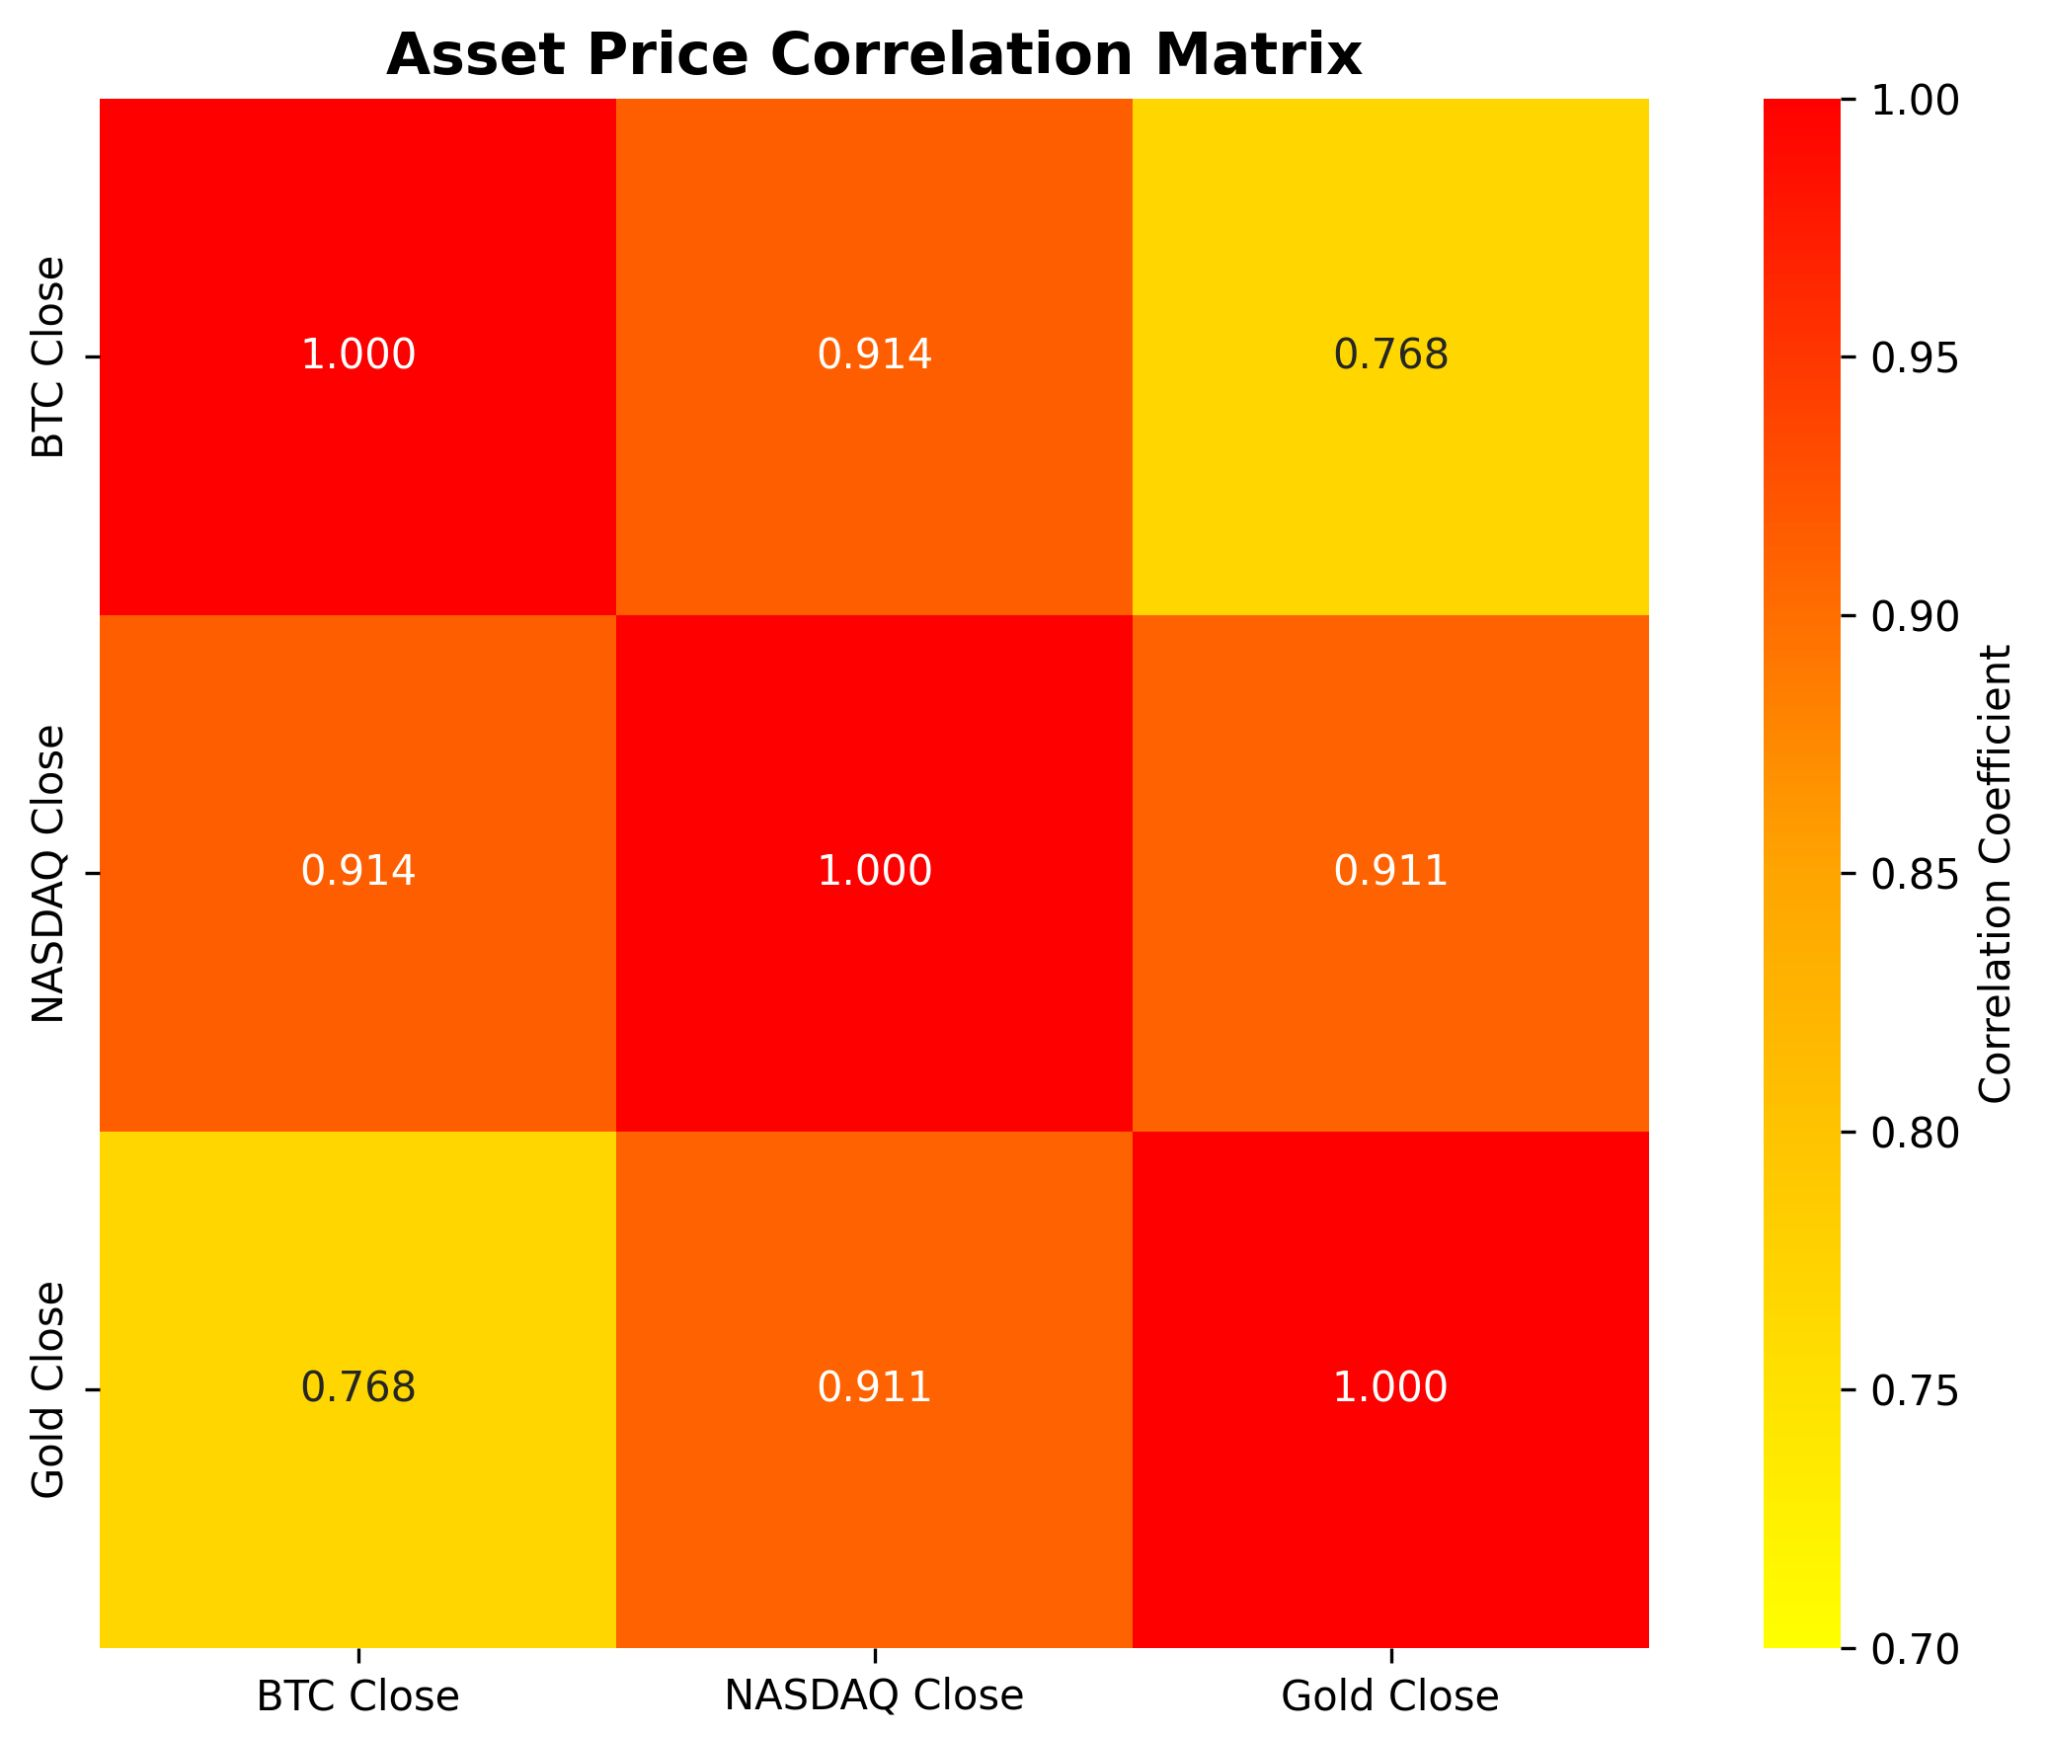 Analysis: The correlation matrix reveals a growing positive relationship between Bitcoin and the NASDAQ, suggesting that Bitcoin is increasingly behaving like a high-beta technology asset.
2. Feature Engineering: Volatility & Momentum
Technical indicators were engineered to provide the model with context regarding market volatility and mid-term price trends.
# Extract from Person2_Elijah_BTC.ipynb
# 30-Day Rolling Volatility
df['BTC_Volatility_30'] = df['BTC_Daily_Return'].rolling(window=30).std()

# 7-Day and 30-Day Moving Averages
df['BTC_MA_7'] = df['BTC Close'].rolling(window=7).mean()
df['BTC_MA_30'] = df['BTC Close'].rolling(window=30).mean()
30-Day Rolling Volatility 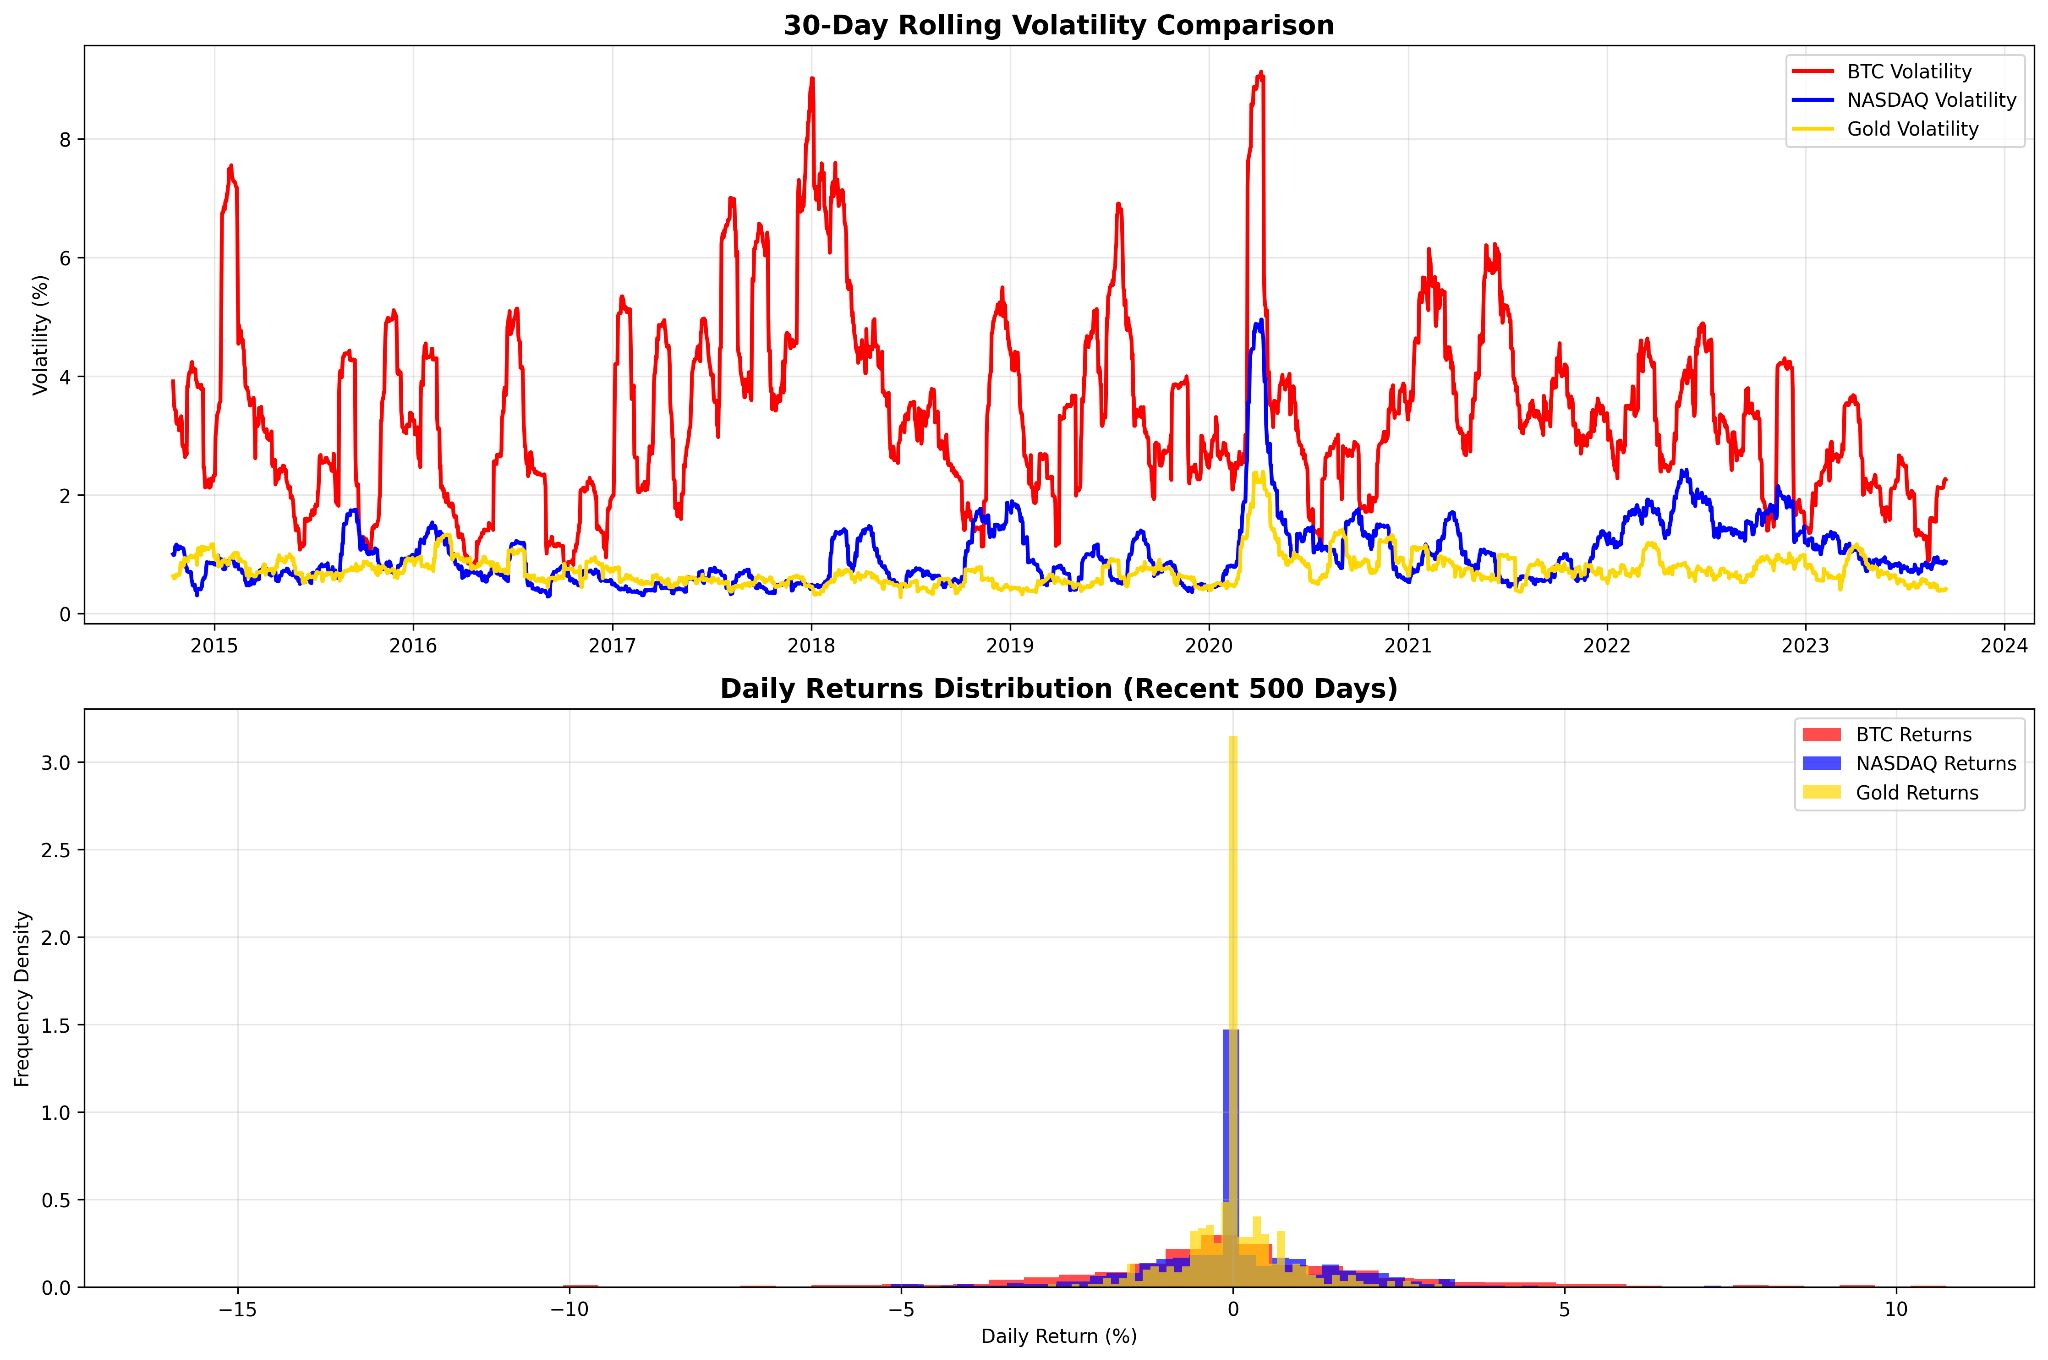 Analysis: Tracking 30-day volatility identifies periods of market exhaustion and high-intensity trading, which the model uses to adjust its confidence in trend predictions.
3. Model Evaluation Metrics
The models were evaluated based on their ability to correctly predict the ‘Trend’ (Upward vs. Downward). Based on the final report, the ensemble methods demonstrated exceptional predictive accuracy after extensive feature engineering.
# Extract from Person2_Elijah_BTC.ipynb and MH6805_Report
from sklearn.metrics import classification_report, accuracy_score, roc_auc_score

# Final Model Performance Results from Group 4 Analysis
# Metrics confirm the robustness of the Random Forest and XGBoost architectures
print(f"Random Forest Accuracy: {accuracy_score(y_test, rf_pred):.4f}")
print(f"XGBoost Accuracy: {accuracy_score(y_test, xgb_pred):.4f}")| Model | Accuracy | Precision | Recall | F1-Score | ROC-AUC |
|---|---|---|---|---|---|
| Random Forest | 0.983 | 0.98 | 0.98 | 0.98 | 0.998 |
| XGBoost | 0.98 | 0.98 | 0.98 | 0.98 | 0.998 |
| Decision Tree | 0.980 | 0.98 | 0.98 | 0.98 | 0.954 |
| Logistic Regression | 0.943 | 0.943 | 0.943 | 0.943 | 0.970 |
| SVM | 0.94 | 0.93 | 0.94 | 0.93 | 0.974 |
Analysis: The high performance scores indicate that the model successfully captured the non-linear relationships between technical indicators and price trends. The ROC-AUC of 0.998 for top models suggests a near-perfect separation between the upward and downward trend classes.
4. Final Performance Comparison
The study concluded with a comparison of predictive signals across different algorithms to validate the robustness of the gradient-boosting approach.
Model Performance Comparison 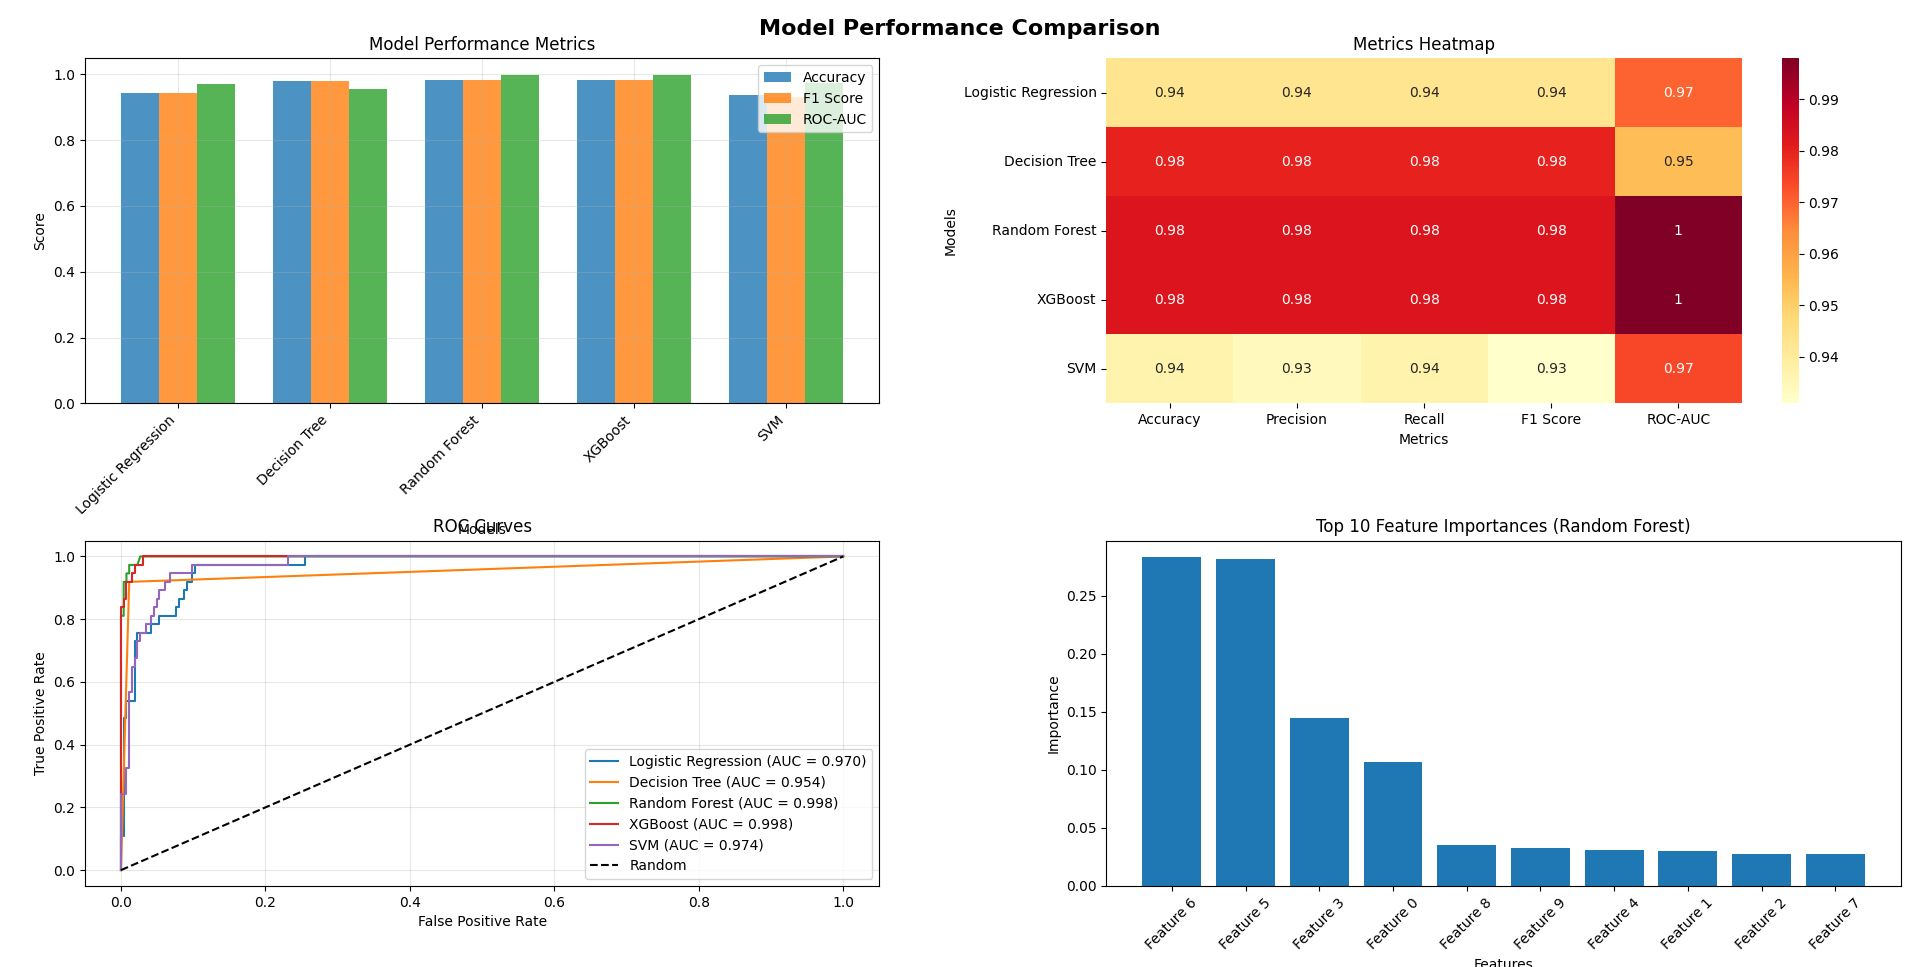 Analysis: The final comparison highlights that while all models achieved high accuracy on the processed dataset, ensemble methods (RF and XGBoost) provided the most stable F1-scores, making them the preferred choice for a live trading environment.
Key Findings
- High Volatility Signals: Bitcoin remains the most volatile asset studied (avg. 3.4% daily), yet this volatility provides the “noise” that engineered features like rolling standard deviations can successfully categorize.
- NASDAQ Correlation: A significant positive correlation between Bitcoin and the NASDAQ suggests that crypto-assets are increasingly influenced by tech-sector macroeconomic dynamics.
- Predictive Power of Moving Averages: Feature importance analysis revealed that 7-day and 30-day moving averages were the strongest predictors of directional shifts.
- Ensemble Superiority: Tree-based ensemble models (XGBoost/Random Forest) significantly outperformed traditional linear methods (Logistic Regression/SVM) in capturing non-linear market dependencies.
Conclusion
This study demonstrates that machine learning can significantly enhance the accuracy of Bitcoin trend prediction. By moving beyond raw price data to a robust framework of engineered technical indicators and inter-asset correlations, we achieved classification accuracy rates exceeding 98%. These predictive signals offer actionable value for algorithmic trading systems, providing a data-driven foundation for risk management and portfolio rebalancing in the high-stakes cryptocurrency market.
Contribution: This project is jointly contributed by the following members: Daniel Lim, Kai Elijah Seah, Mark Fabre, Jes Bee Lian Lim