Credit Card Fraud Detection
Project Summary
This project addresses the critical challenge of detecting fraudulent credit card transactions within a highly imbalanced dataset (0.17% fraud rate). Utilizing a dataset of European cardholder transactions, the analysis focuses on identifying patterns in PCA-transformed features while handling the extreme rarity of fraud cases. The solution implements a robust Random Forest classification pipeline, featuring custom feature engineering and cost-sensitive learning to minimize financial losses from undetected fraud.
Technical Design Elements
The project architecture is built on four technical pillars:
Data Integrity: Automated auditing for duplicates and memory optimization.
Advanced Feature Engineering: Addressing feature skewness via Log transformations and creating temporal features (Time-of-day bins) to capture cyclical fraud patterns.
Resampling Strategy: Evaluation of SMOTE, Random Over-sampling, and Hybrid methods to provide the model with sufficient minority class signal.
Cost-Sensitive Optimization: Shifting from standard accuracy metrics to a cost-based evaluation where False Negatives (missed fraud) are weighted significantly higher than False Positives.
1. Dataset Inspection
The initial audit identified the dataset structure and a small percentage of duplicate entries that were addressed to ensure model validity.
# Extract from MH6804_Required Group_Project_Report Team 4.py
def inspect_dataset(file_path):
    df = pd.read_csv(file_path)
    print("DATASET OVERVIEW")
    print(f"Dataset Dimensions: {df.shape[0]} rows, {df.shape[1]} columns")
    print(f"Memory Usage: {df.memory_usage().sum() / 1024 ** 2:.2f} MB")
    print(f"Duplicate Rows: {df.duplicated().sum()}")
    return df

df = inspect_dataset('creditcard.csv')| Metric | Value |
|---|---|
| Total Transactions | 284,807 |
| Fraudulent Cases | 492 (0.17%) |
| Duplicate Rows | 1,081 |
| Data Size | 67.36 MB |
2. Feature Engineering & Exploration
Since most features are PCA-anonymized, the engineering focuses on the ‘Amount’ and ‘Time’ variables. Correlation analysis reveals which components carry the strongest signals for fraud.
# Handling Skewed Amount
df['log_amount'] = np.log1p(df['Amount'])

# Temporal Engineering
df['hour'] = (df['Time'] / 3600) % 24
df['part_of_day'] = pd.cut(df['hour'], bins=[0,6,12,18,24], labels=['Night', 'Morning', 'Afternoon', 'Evening'])

# Analyzing Correlations
corr_matrix = df.corr()
Predictive Power by Feature 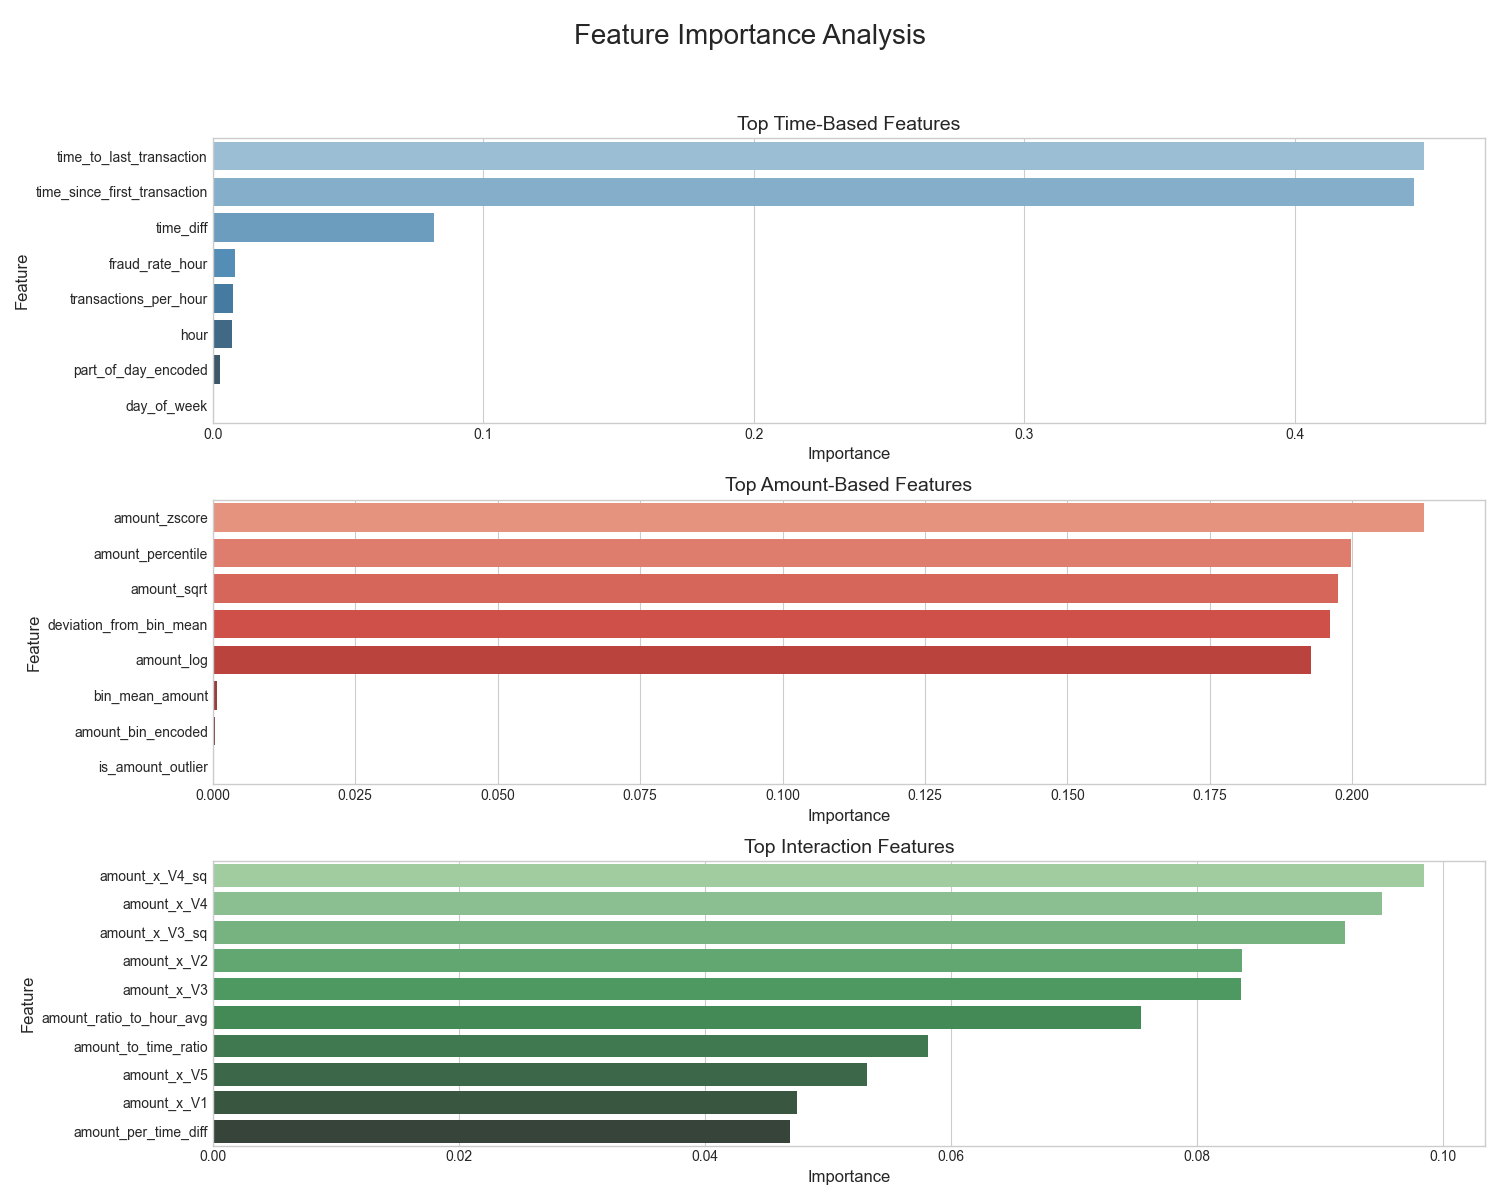
Cost Curve Optimization 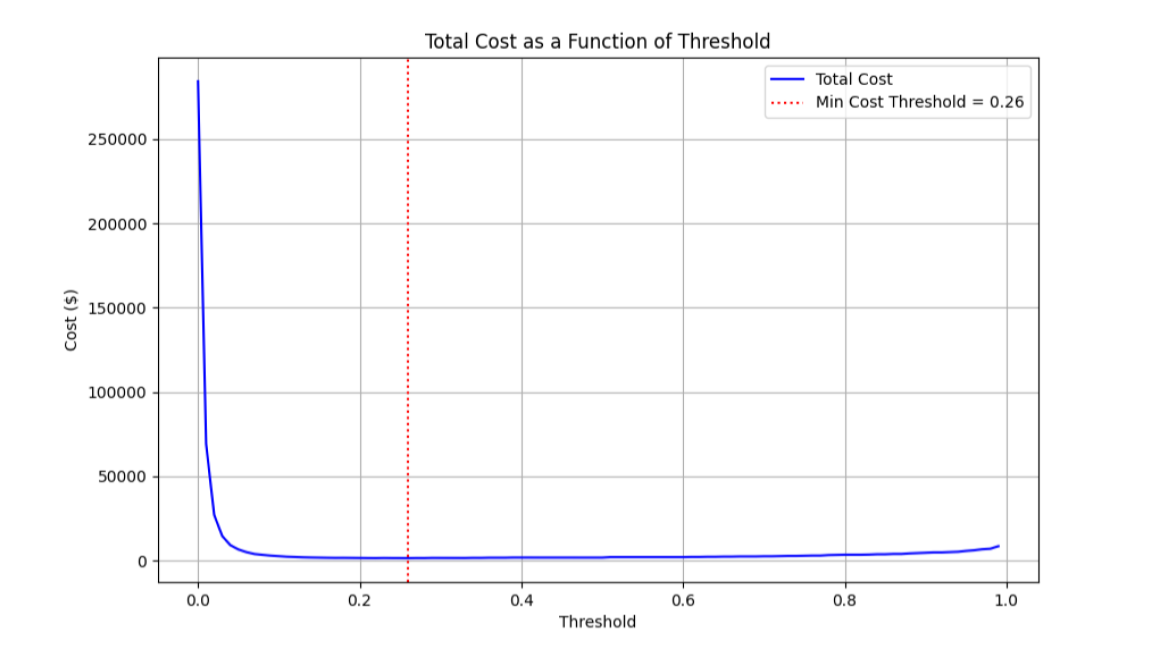
Final Test Set Performance 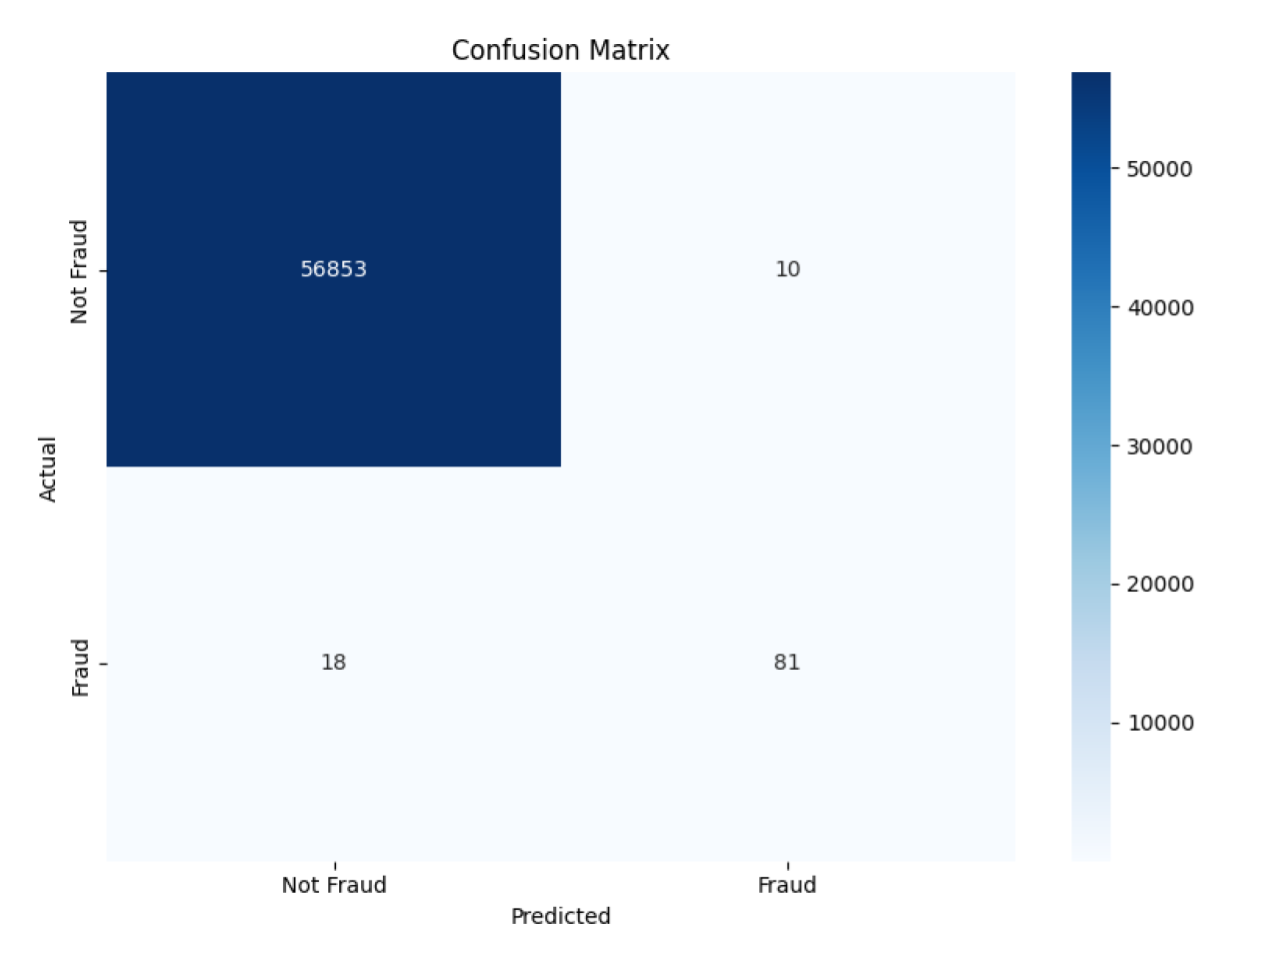
3. Handling Class Imbalance
To prevent the model from defaulting to “Non-Fraud” for every case, SMOTE (Synthetic Minority Over-sampling Technique) was implemented to balance the training distribution.
from imblearn.over_sampling import SMOTE

# Resampling to create a balanced training environment
smote = SMOTE(random_state=42)
X_resampled, y_resampled = smote.fit_resample(X_train, y_train)
Effect of Sampling on Data Distribution 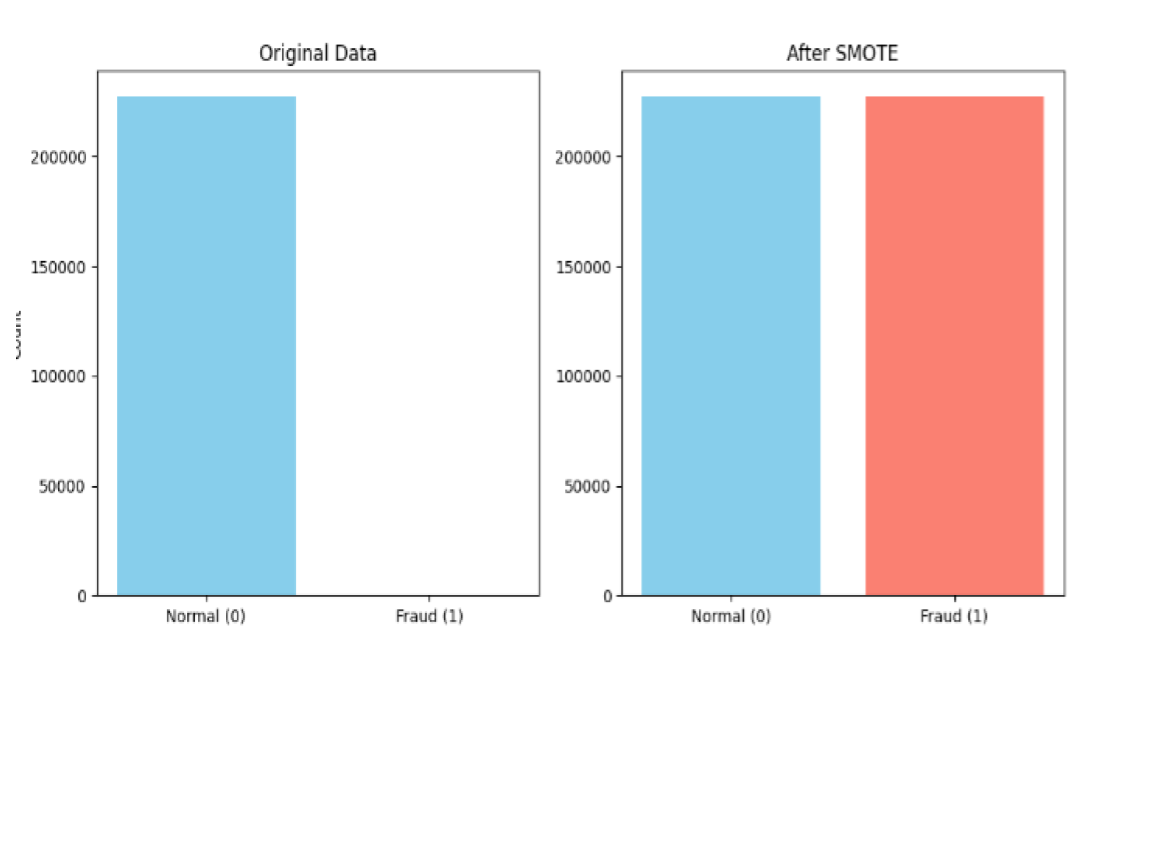 Analysis: This comparison highlights how SMOTE populates the minority class feature space, allowing the classifier to learn the decision boundary for fraud rather than being overwhelmed by the majority class.
4. Final Model Evaluation
The Random Forest model was selected as the best performer. Beyond standard metrics, the project uses a feature importance analysis to maintain model transparency and a cost curve to find the most economical operating threshold.
# Feature Importance Extraction
importances = rf_model.feature_importances_

# Cost Optimization: $100 penalty for FN, $5 penalty for FP
costs = []
for t in thresholds:
    tn, fp, fn, tp = confusion_matrix(y_test, (y_proba >= t)).ravel()
    costs.append((fn * 100) + (fp * 5))

min_cost_threshold = thresholds[np.argmin(costs)]
Predictive Power by Feature Analysis: The importance plot confirms that V17 and V14 are the most critical variables for the Random Forest model, validating the insights previously seen in the correlation heatmap.
Cost Curve Optimization Analysis: By plotting the financial impact across various probability thresholds, we identify the “Sweet Spot” that balances the high cost of missing a fraud case against the operational cost of investigating false alarms.
Final Test Set Performance Analysis: The matrix demonstrates the final model’s high precision (0.89) and recall (0.82) on the unseen test set, successfully capturing the majority of fraudulent transactions with minimal false positives. ***
Contribution: This project is jointly contributed by the following members: Daniel Lim, Mark Joseph Fabre, Jes Bee Lian