Stock Price Tracker
Project Summary
The “Stock Price Tracker” is a comprehensive desktop application designed to empower users with real-time financial oversight. Built using Python’s Tkinter library (via customtkinter), the tool integrates the MarketStack API to fetch live stock prices and historical data. The system enables users to manage a personal investment database, track portfolio allocations through visual charts, and maintain a watchlist of potential assets, all within a modern graphical interface.
Technical Design Elements
The application architecture is modular, separating concerns into four key functional areas:
User Interface (UI): Utilizes
customtkinterfor a responsive, event-driven dashboard with persistent sidebar navigation.API Integration: Connects to the MarketStack REST API to retrieve real-time quotes and search for global stock tickers.
Data Persistence: Implements a local SQLite database (via the Portfolio module) to store user transactions, purchase history, and asset quantities.
Financial Visualization: Leverages
matplotlibto render dynamic allocation pie charts and performance graphs directly within the Tkinter canvas.
1. Dashboard & Navigation
The core of the application is a centralized dashboard. It manages the session state, including the user’s current budget and navigation between the market search and portfolio views.
# Extract from MH6803_Required Group_Project_code Group 4.py
class DashboardApp:
    def __init__(self, root, user_name, budget, watchlist=None):
        self.root = root
        self.root.title("Dashboard")
        self.root.geometry("1080x800")
        self.user_name = user_name
        self.budget = budget
        self.watchlist = watchlist if watchlist is not None else []
        self.create_dashboard()

    def create_dashboard(self):
        """Displays the dashboard with a sidebar and user info."""
        self.user_label = theme.create_label(
            self.root, f"Welcome, {self.user_name}! Your budget: ${self.budget:,.2f}"
        )
        self.user_label.place(x=250, y=20)
        self.sidebar = ctk.CTkFrame(self.root, width=200, height=800)
        self.sidebar.pack(side="left", fill="y", padx=20, pady=40)
User Navigation Interface 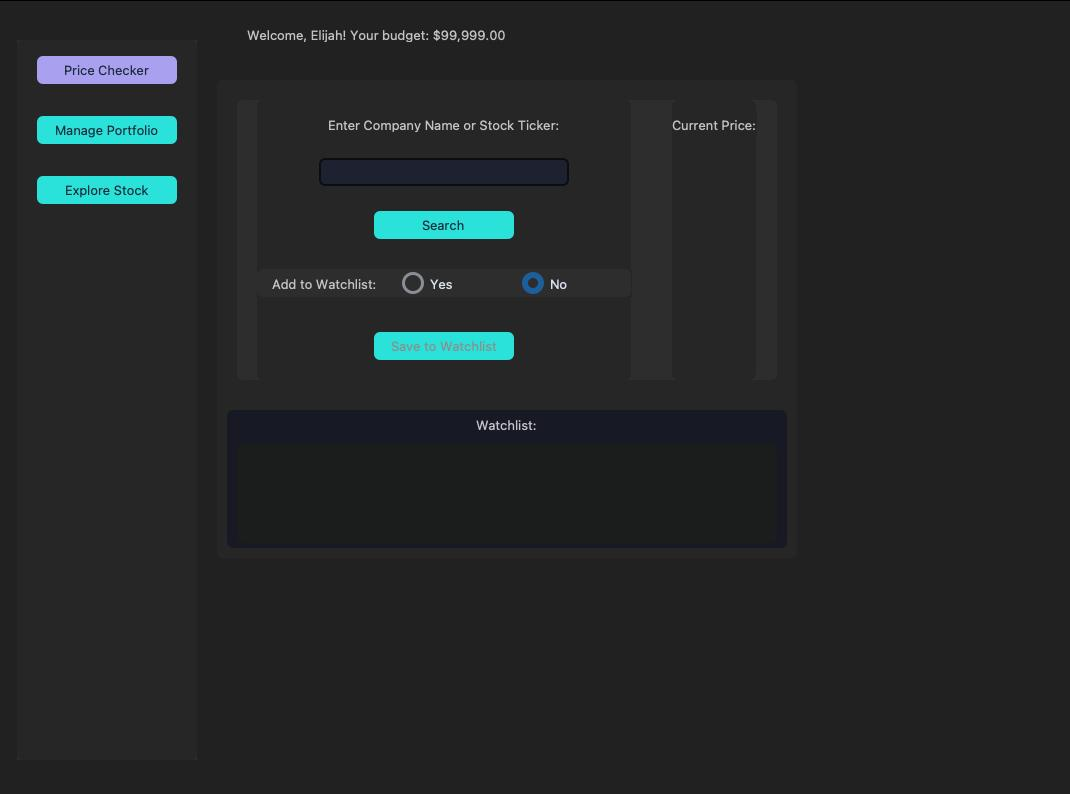 Analysis: The interface provides a clear entry point for users to search for companies by name or ticker. The sidebar remains persistent to allow quick switching between market data and personal holdings.
2. MarketStack API Integration
This segment handles external data fetching. It processes JSON responses from the MarketStack API to display current market prices and investment feasibility based on the user’s available budget.
# Logic derived from MH6803_Required_Group_Project_Report_Team_4 .pdf
# Search results are parsed from the MarketStack API endpoint:
# [http://api.marketstack.com/v1/tickers](http://api.marketstack.com/v1/tickers)

def perform_search(self, symbol):
    # API call logic to fetch 'last_price' and 'change'
    # Validates ticker against MarketStack database
    pass
Live Asset Searching 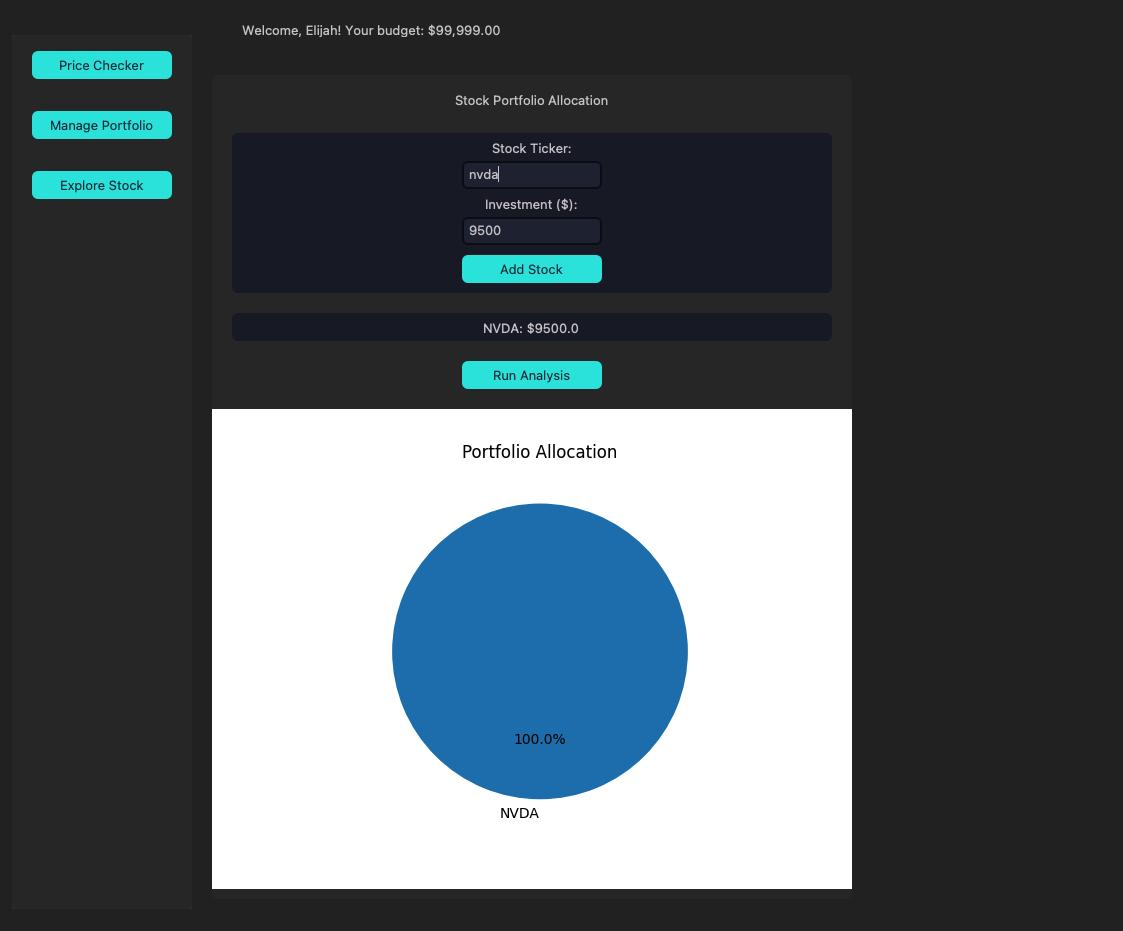 Analysis: The Search UI allows users to define an investment amount. The application then calculates the potential share purchase and updates the visualization to show how this new ticker fits into the current market context.
3. Portfolio Management & Tracking
The portfolio module calculates the total value of current holdings by multiplying stored share quantities with live prices fetched from the API.
# Logic from MH6803 PortfolioTracker Module
def update_portfolio_value(self):
    total_val = 0
    for asset in self.db.get_all_assets():
        current_price = api.get_live_price(asset['symbol'])
        total_val += (current_price * asset['quantity'])
    self.total_value_label.configure(text=f"Total: ${total_val:,.2f}")
Holdings and Valuation 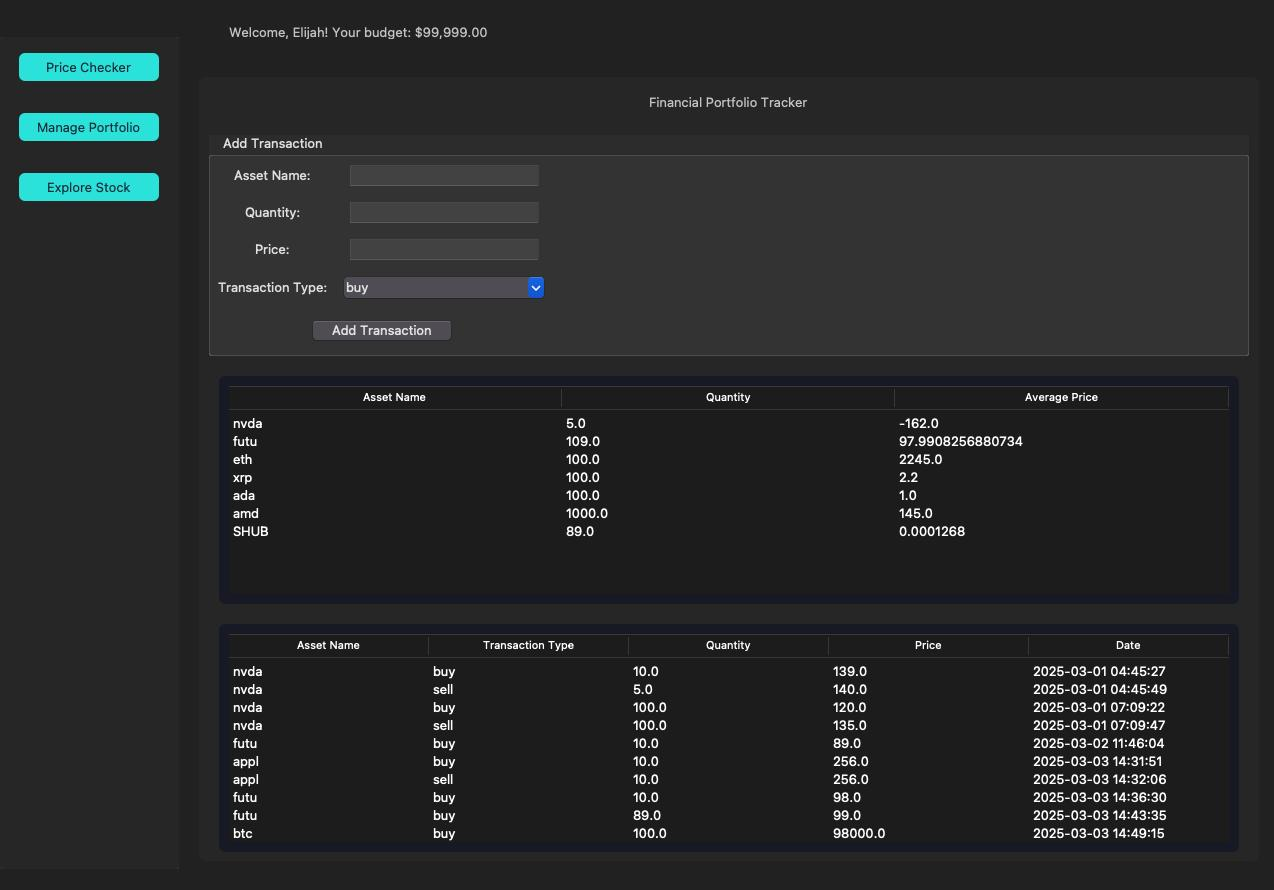 Analysis: This view summarizes the user’s financial position, listing each asset with its quantity and purchase price while calculating the aggregate portfolio value dynamically.
4. Visual Analysis & Allocation
To assist in diversification, the application generates a visual breakdown of the portfolio. This ensures users can see their exposure to specific stocks at a glance.
Portfolio Distribution 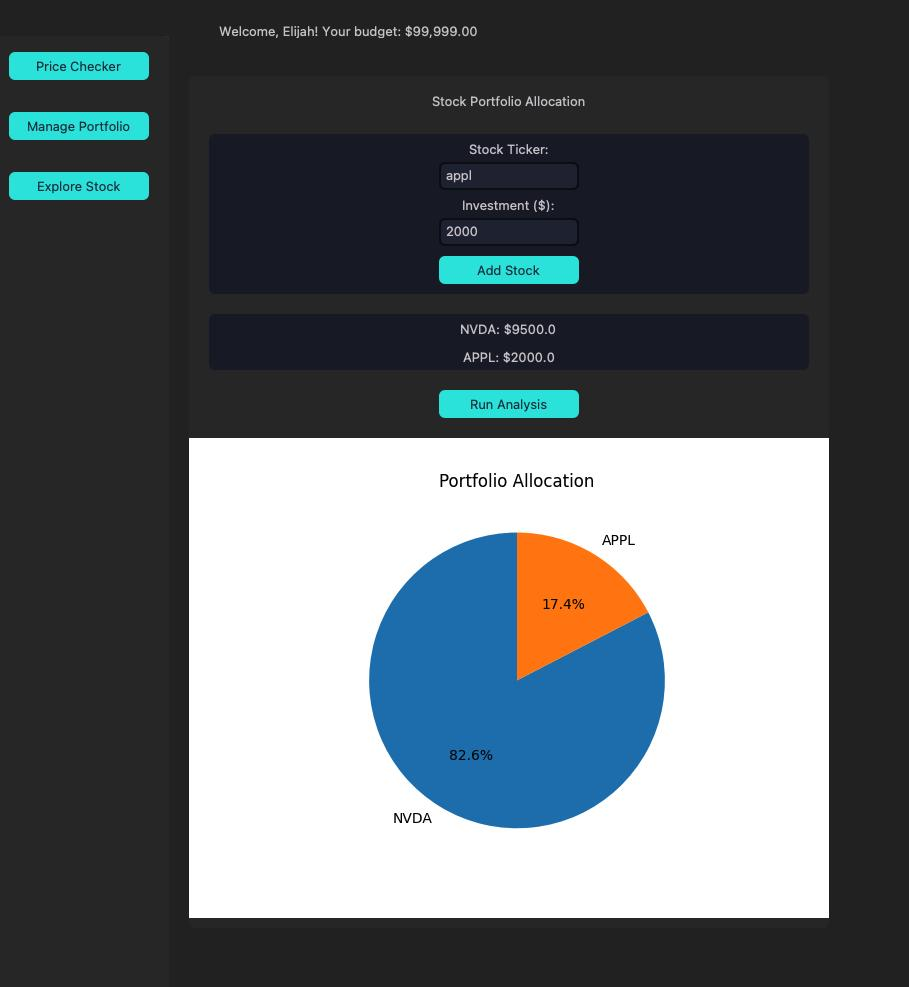 Analysis: The Matplotlib-generated pie chart illustrates the weight of each stock (e.g., NVDA vs. APPL) within the portfolio. This visualization is critical for managing investment risk and ensuring a balanced asset allocation.
Contribution: This project is jointly contributed by the following members: Daniel Lim, Kai Elijah Seah, Mark Joseph Fabre, Jes Bee Lian Lim